You are using an out of date browser. It may not display this or other websites correctly.
You should upgrade or use an alternative browser.
You should upgrade or use an alternative browser.
Behaviour of cells in parallel take 2
- Thread starter Wolf
- Start date

daromer
Moderator
- Joined
- Oct 8, 2016
- Messages
- 5,665
If the hardware is correct the voltage can not differ unless you hit the roof of the IR of the cells. Note that when testing 
Not when meassured on the same spot. With that said you have a different potential inside so if your current sensing is correct you can sense a slight backflow when stopping a high current charge or discharge. On our setups thats though minimal.
Not when meassured on the same spot. With that said you have a different potential inside so if your current sensing is correct you can sense a slight backflow when stopping a high current charge or discharge. On our setups thats though minimal.
Wolf
Moderator
- Joined
- Sep 25, 2018
- Messages
- 2,009
It has been brought to my attention that there is a major flaw in my testing rig that may skew the results somewhat between the interaction that happens between parallel cells. I humbly apologise. I will correct this error and redo the tests.
Brief explanation of the problem and the steps to correct it.
The INA219 uses a 100mΩ shunt resistor to measure the current which puts an unusually high resistance between the cells. You see, between any 2 cells there is a 200mΩ resistance which can skew the results to a certain degree. You all know what a stickler I am for accuracy so this is an inexcusable error on my part. GRRR.
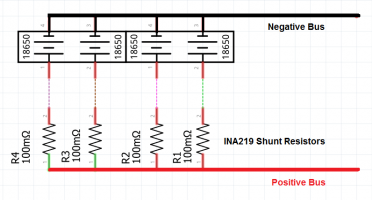
To correct this error I will replace the INA219 with an INA260 that has a shunt resistor with a value of 2mΩ, greatly reducing any interference with the flow of current. There are other advantages to the INA260 it has better ADC (16 bit) resolution and the DC V and I accuracy is also improved.
Once done we will see what the results are.
Please feel free to post test requests and I will try to accommodate according to time and resources. I.e. do I have the cells you specify in the IR/mAh range.
Wolf
Brief explanation of the problem and the steps to correct it.
The INA219 uses a 100mΩ shunt resistor to measure the current which puts an unusually high resistance between the cells. You see, between any 2 cells there is a 200mΩ resistance which can skew the results to a certain degree. You all know what a stickler I am for accuracy so this is an inexcusable error on my part. GRRR.

To correct this error I will replace the INA219 with an INA260 that has a shunt resistor with a value of 2mΩ, greatly reducing any interference with the flow of current. There are other advantages to the INA260 it has better ADC (16 bit) resolution and the DC V and I accuracy is also improved.
Once done we will see what the results are.
Please feel free to post test requests and I will try to accommodate according to time and resources. I.e. do I have the cells you specify in the IR/mAh range.
Wolf
Last edited:
Ebikeforlife
Member
- Joined
- Jan 6, 2021
- Messages
- 36
@Wolf
That sounds fantastic and probably as close as you can possibly get.
Other than the results, my interest would be to 2 points.
1: If we see depletion of the lower capacity cells first, is there a current flow from higher capacity cells to depleted cells across the parallel connection
2: when the lower cells are depleted, before any equalisation current, what are the cell voltages.... is the lower capacity cells at 2.9v ansd higher capacity at 3.15v for instance
daromer
Moderator
- Joined
- Oct 8, 2016
- Messages
- 5,665
Ebikeforlif:
1. impossible unless you stress the cells. Ohms law. You need higher current than the cell can deliver if that to be happen = Bad design.
2. TOTALLY impossible. They are in parallel and cant have different voltages. The voltage difference can only be the current passing minus the resistance in the leads. And if that happens you use 200% of what the cell can deliver.

You can see different currents going in and out of the cells but the voltage shall be the same or you d something wrong.
1. impossible unless you stress the cells. Ohms law. You need higher current than the cell can deliver if that to be happen = Bad design.
2. TOTALLY impossible. They are in parallel and cant have different voltages. The voltage difference can only be the current passing minus the resistance in the leads. And if that happens you use 200% of what the cell can deliver.
You can see different currents going in and out of the cells but the voltage shall be the same or you d something wrong.
Ebikeforlife
Member
- Joined
- Jan 6, 2021
- Messages
- 36
Wolf
Moderator
- Joined
- Sep 25, 2018
- Messages
- 2,009
You gotta rub it in don't youIt can be seen in Wolfs earlier tests too. Its just that his voltage meassurement wasnt spot on
ajw22
Member
- Joined
- Nov 16, 2018
- Messages
- 733
Tests with more realistic powerwall situations in mind:
* To simulate low voltage shutdowns, stop the discharge at more typical settings (eg. 3.5v and 3.3v). Repeat with 200mA/cell draw.
* To simulate morning transition from battery to solar power, gradually lower draw over an hour or so, smoothly switching over to charging.
I'm expecting virtually no balancing current flowing between the cells, because any balancing current would be overshadowed by the charging current.
Wolf
Moderator
- Joined
- Sep 25, 2018
- Messages
- 2,009
It's alive.
The original board with the INA219 boards. I am thinking of replacing the cell holders with the better quality ones you see in the upper right corner.
Once we know this works as expected I will solder all to a permaboard.
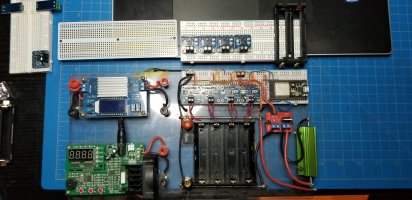
The INA260 boards installed, sketch modified and uploaded.

And we have a heartbeat.


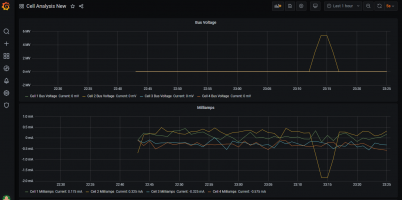
Let the games begin.
Wolf
The original board with the INA219 boards. I am thinking of replacing the cell holders with the better quality ones you see in the upper right corner.
Once we know this works as expected I will solder all to a permaboard.

The INA260 boards installed, sketch modified and uploaded.

And we have a heartbeat.

Let the games begin.
Wolf
Wolf
Moderator
- Joined
- Sep 25, 2018
- Messages
- 2,009
No worries I will test with all kinds of scenarios. This will be fun.Tests with more realistic powerwall situations in mind:
* To simulate low voltage shutdowns, stop the discharge at more typical settings (eg. 3.5v and 3.3v). Repeat with 200mA/cell draw.
* To simulate morning transition from battery to solar power, gradually lower draw over an hour or so, smoothly switching over to charging.
I'm expecting virtually no balancing current flowing between the cells, because any balancing current would be overshadowed by the charging current.
Wolf
Moderator
- Joined
- Sep 25, 2018
- Messages
- 2,009
Anyone that wants to see the data in real time can view it at:
username is guest and password is guestw
Right now its got 4 cells (Sanyo NCR18650GA 3300mah) in parallel going through a couple of C/D/C cycles to get a baseline.
Wolf
username is guest and password is guestw
Right now its got 4 cells (Sanyo NCR18650GA 3300mah) in parallel going through a couple of C/D/C cycles to get a baseline.
Wolf
Last edited:
daromer
Moderator
- Joined
- Oct 8, 2016
- Messages
- 5,665
Note that Ina260 have 4.5mOhm resistance between input and output and then you have your own resistance in the wires and connection. WIth that said it should not diff the result much at all. You should get the voltage within the error margin on all cells minus the resistance
so at 1A test you will get a drift of up to 15mV i think it is. I just quickly banged the numbers in my head.
You have around 10mOhm between the measure points and then its normal drift as well And then the error margin between the 2 boards.
Feel free to crosscheck this Wolf. I will gladly help you crank some numbers to get nice result!
Note that i have not taken into account the holders or its connectin that most likely can drift a mV or 3 as well.
Wolf
Moderator
- Joined
- Sep 25, 2018
- Messages
- 2,009
No need to cross check your brilliance buuuut....... No just kidding .
.
I have done the measurements and here is what they are.
INA260 measured all 4 and they were so close it is not worth mentioning. Result 4.958mΩ

Ground Bus to cell holder (Measured all 4 and again the tolerances were negligible) Result .946mΩ
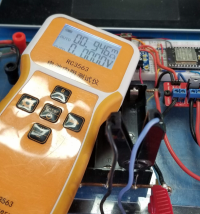
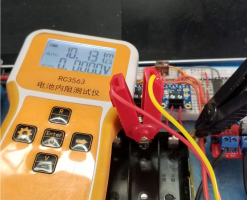
Then I measured the Positive Bus which goes through the INA260 to the cell holder. 10.13mΩ. Again negligible differences between all 4 measurements.
As a side note I did measure the resistance of the new style cell holders and was surprised at how much resistance they had if you use the PCB contact. Result 6.977mΩ
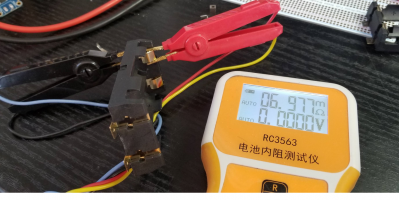
So total Analyzer resistance for each cell is 11.076mΩ and between any 2 cells is 22.152mΩ.
OK so to the baseline of the NCR18650GA Cells. The tester is looking good and performing as expected. Here is the trace from the first heartbeat to a regular rhythm of a 3 cycle C/D/C..
Also the cell temp readings are looking good.

I have just inserted 4 cells. These are new cells, 2 ICR189650-26J and 2 INR18650-25R.
Cell 1 #16 39.43mΩ 4.150V ICR189650-26J
Cell 2 #17 39.74mΩ 4.146V ICR189650-26J
Cell 3 #21 13.70mΩ 4.132V INR18650-25R
Cell4 #22 14.04mΩ 4.130V INR18650-25R
They are equalizing right now and in a bit I will run a 3 cycle C/D/C trace on them. As you can see they are both about the same capacity but IR is quite different. I also have added a 10min rest period between cycles. This test is charge to 4.2V, discharge to 3.0V @ 1A.
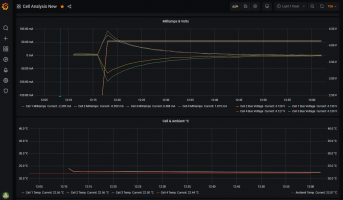
Remember you can at anytime view this graph and if you want you can download the data as a csv.
http://wolftech.mynetgear.com:4562/d/myaGzm5Wz/cell-analysis-new?orgId=1&refresh=5s&from=now-24h&to=now
Update: 7/14/2023 login to chart no longer available experiment has passed,
username is guest and password is guestw
You can select the time of the data you want in the upper right corner. Or you can swipe the graph with your mouse
Just click the header click on inspect, chose data and then transformer and select join by time. Then you can download the CSV.
Ready set go!

Wolf
I have done the measurements and here is what they are.
INA260 measured all 4 and they were so close it is not worth mentioning. Result 4.958mΩ

Ground Bus to cell holder (Measured all 4 and again the tolerances were negligible) Result .946mΩ

Then I measured the Positive Bus which goes through the INA260 to the cell holder. 10.13mΩ. Again negligible differences between all 4 measurements.

As a side note I did measure the resistance of the new style cell holders and was surprised at how much resistance they had if you use the PCB contact. Result 6.977mΩ

So total Analyzer resistance for each cell is 11.076mΩ and between any 2 cells is 22.152mΩ.
OK so to the baseline of the NCR18650GA Cells. The tester is looking good and performing as expected. Here is the trace from the first heartbeat to a regular rhythm of a 3 cycle C/D/C..
Also the cell temp readings are looking good.

I have just inserted 4 cells. These are new cells, 2 ICR189650-26J and 2 INR18650-25R.
Cell 1 #16 39.43mΩ 4.150V ICR189650-26J
Cell 2 #17 39.74mΩ 4.146V ICR189650-26J
Cell 3 #21 13.70mΩ 4.132V INR18650-25R
Cell4 #22 14.04mΩ 4.130V INR18650-25R
They are equalizing right now and in a bit I will run a 3 cycle C/D/C trace on them. As you can see they are both about the same capacity but IR is quite different. I also have added a 10min rest period between cycles. This test is charge to 4.2V, discharge to 3.0V @ 1A.

Remember you can at anytime view this graph and if you want you can download the data as a csv.
http://wolftech.mynetgear.com:4562/d/myaGzm5Wz/cell-analysis-new?orgId=1&refresh=5s&from=now-24h&to=now
Update: 7/14/2023 login to chart no longer available experiment has passed,
username is guest and password is guestw
You can select the time of the data you want in the upper right corner. Or you can swipe the graph with your mouse
Just click the header click on inspect, chose data and then transformer and select join by time. Then you can download the CSV.

Ready set go!

Wolf
Last edited:
daromer
Moderator
- Joined
- Oct 8, 2016
- Messages
- 5,665
Good. So up to 25mV diff between the cells should be seen and never more than that during normal operation and you are good to go. And we should be able to see the different currents from the cells. Though back/front current must be subtracted with same amount based on the losses due to above ir 
Wolf
Moderator
- Joined
- Sep 25, 2018
- Messages
- 2,009
Noted!You can add the difference in the grafs in grafana too. So you get a graf showing max deviation if you want
The journey has begun anew. Lets see what happens.
To all ..............................
I am building a matrix of cells to test. I have new, used and abused.
So don't be shy to ask for a set of 4 to be tested. Just give me a set of parameters i.e. cell manufacturer, part number max V to charge to min V to discharge to Amp load. Amp charge etc. I am waiting for some cells to reach ≥25 day maturity for SD test so I have some time.
My discharge board also has the capability of timing a load Resistor (2Ω but changeable) on and off I.e. 3 min on 3 min off which is adjustable,. This can be helpful to see the interaction between cells under a load and the recovery transactions that takes place between the cells after the load has been removed.
I have not worked on varying the load through time. ( Sketch guru listening?)
Small representation of my cell stock.

Wolf
daromer
Moderator
- Joined
- Oct 8, 2016
- Messages
- 5,665
I would say its most interesting to see
1. All same high qual
2. All same low qual
3. One of each category from good to bad. Lets say 100, 80, 40, 20 mOhm
4. One good rest bad
5. One bad rest good.
6. Different types of cells. Ie Chem types.
Why this is because above shuld yield a decent result that its best to vary the the cells but keep the spread to a minimum if is it a must.
Above tests can be done at low current lets say 200mA but also at high current 1A (Per cell)
The low current tests can be skipped when all cells are the same since that wont give any different result from the high current.
Then of course the chem types are rather interesting where and how the spread but no news though
The challenge here is not to do the tests. The challenge is to present them so 90% of the people understand the result and not only that the 2% of us working with it understand the outcome and that the rest gets scared or get conclusions that arent correct Like that you can make Lithium "Safe"... You can make it safer but never 100% safe
1. All same high qual
2. All same low qual
3. One of each category from good to bad. Lets say 100, 80, 40, 20 mOhm
4. One good rest bad
5. One bad rest good.
6. Different types of cells. Ie Chem types.
Why this is because above shuld yield a decent result that its best to vary the the cells but keep the spread to a minimum if is it a must.
Above tests can be done at low current lets say 200mA but also at high current 1A (Per cell)
The low current tests can be skipped when all cells are the same since that wont give any different result from the high current.
Then of course the chem types are rather interesting where and how the spread but no news though
The challenge here is not to do the tests. The challenge is to present them so 90% of the people understand the result and not only that the 2% of us working with it understand the outcome and that the rest gets scared or get conclusions that arent correct
Wolf
Moderator
- Joined
- Sep 25, 2018
- Messages
- 2,009
I will prepare the cells for testing and post the results.I would say its most interesting to see
1. All same high qual
2. All same low qual
3. One of each category from good to bad. Lets say 100, 80, 40, 20 mOhm
4. One good rest bad
5. One bad rest good.
6. Different types of cells. Ie Chem types.
The challenge here is not to do the tests. The challenge is to present them so 90% of the people understand the result and not only that the 2% of us working with it understand the outcome and that the rest gets scared or get conclusions that arent correctLike that you can make Lithium "Safe"... You can make it safer but never 100% safe


