DC IR VS AC 1kH IR measurements

gauss163 : Would a cell with a 1kHz load have more cycle life than a purely DC load (assuming the same energy per cycle) ?
 
Wolf said:
[...]Have you even looked at the pivot chart in my harvested cell analysts sheet where you can select a cell manufacturer and mode number and see the IR to capacity correlation? It has over 6000 cells in it from various manufactures and the trend is as clear as crystal.

image_rmsqae.jpg

Ok, let's see if we can sync your observations with said theory. First your graph shows that cells with very high AC IR have very bad capacity - which is as expected (same would be true for DC IR).Most of the other cells in that chart are all all close to100% SOH and have close to the minimal AC IR, again as expected.

There are onlya few cells listed with SOH between these extremes - two about83% and one at 77% SOH. Butthey have thesame AC IR as other cells near100% SOH so AC IR can't detect these significant SOH differences. But likelythe DC IR will detect it.But I can't verify that since I can'tfind the DC IR values anywhere (and it seems the cell numbers are incorrect so I can't easily look them up).

To get better intuitionit would help to have a wider distribution of SOH that includes more of these discrepancies.


completelycharged said:
gauss163 : Would a cell with a 1kHz load have more cycle life than a purely DC load (assuming the same energy per cycle) ?

I don't recallany studies that compare such. Cycle life studies are very expensive so they are (relatively) few and far between.

There are some studies on pulse-charging but it's not clear if they translate to pulsed loads, e.g. below

From Capacity fade studies of Lithium Ion cells, by B. Popov et al.

Conclusions

Pulse charging increases the discharge capacity of the cell.

Pulse charging decreases the cell impedance by increasing the utilization of Li.

Discharge capacities evaluated at different cycle numbers indicated that pulse charged batteries retain more capacity.

From The effects of pulse charging on cycling characteristics of commercial lithium-ion batteries by Jun Li et al.

The results show that pulse charging is helpful in eliminating concentration polarization, increasing the power transfer rate, and lowering charge time by removing the need for constant voltage charging in the conventional protocol ... pulse charging maintains the stability of the LiCoO2 cathode better than dc charging and inhibits the increase in the thickness of the passive film on the anode during cycling

You can find more recent work by chasing links to the above.
 
Because its true on its normal span of cycles/lifecycle. IR do not change much during a normal life. You will also see when digging deeper that most places never talk about what happens to a cell when you drastically extend the cycle life of a battery :)


BUT with that said and we all know that this is a generic saying based on tests and theories. I would say that Batterylife also do flatten alot of the information on how things work around batteries. The information on that site works well as long as you only rely on that information only.
If you start reading scientific papers around this and start to test it heavily you will see that they left out details :)

Something you need to consider to when reading paper is the result. How did they come up with the result? Many papers dont have a big enough test range for it to even be conclusive. Testing 10 cells give nothing of real life more than an indication.
 
gauss163 said:
There are onlya few cells listed with SOH between these extremes - two about83% and one at 77% SOH. Butthey have thesame AC IR as other cells near100% SOH so AC IR can't detect these significant SOH differences.

You are talking about Cell # 1210,1220, and 1245

image_wqbtaf.jpg

Actually if you took the time to dig through my excel sheet you would see that out of 171 tested CGR18650CGs 3 of them "failed" with a "normal AC IR" Oddly enough the Liitokala and Opus didn't think the DC IR was that bad. So what gives?
Maybe a tester malfunction who knows but as far as statistics is concerned these 3 blips are noise. when you look at the whole picture
as in the pivot table it becomes a bit clearer or if you look at the whole 171count. Posted here for your viewing pleasure.

image_ycpqhr.jpg


But likelythe DC IR will detect it.But I can't verify that since I can'tfind the DC IR values anywhere (and it seems the cell numbers are incorrect so I can't easily look them up).
The cell numbers are correct and you can look them up easily enough. Additionally the DC IR is posted there.A little mouse hover over the chartwill reveal the cell number and then you can filter the sheet with those numbers. Simple really if you know how to use excel.
If you are using it in google sheets forget about it download the sheet and open it in excel.

image_nhwzzz.jpg

To get better intuitionit would help to have a wider distribution of SOH that includes more of these discrepancies.
Plenty of discrepancies in a sheet with over 6000 cells.............. LOL

So that brings me to my next point.
When are we going to see your testing procedures, results and numbers,not just spewing studies and academia. We are mainly DIY here not academics pulling from this study or that study. Most of us have actually had to work on and fix the engineering fopas made by academics and engineers.
We are where the rubber hits the road, true life experience with hundreds of thousands if not millions of cells in use. Most of them have not even been checked for AC IR let alone DC IR.
IIRC this will be the 3rd time I have asked you to share your work with us but I have not seen any........................ crickets................

Here is the start of my DC IR tester. Ill show you mine if you show me yours :p
Wolf

image_lyvxxd.jpg
 
daromer said:
Because its true on its normal span of cycles/lifecycle. IR do not change much during a normal life. You will also see when digging deeper that most places never talk about what happens to a cell when you drastically extend the cycle life of a battery :)


BUT with that said and we all know that this is a generic saying based on tests and theories. I would say that Batterylife also do flatten alot of the information on how things work around batteries. The information on that site works well as long as you only rely on that information only.
If you start reading scientific papers around this and start to test it heavily you will see that they left out details :)

Something you need to consider to when reading paper is the result. How did they come up with the result? Many papers dont have a big enough test range for it to even be conclusive. Testing 10 cells give nothing of real life more than an indication.

I too found that most of the book is too vague https://www.scribd.com/document/36910556...le-devices
I don't think the author did their own tests. There is too much information missing to support the conclusions they arrive at. What did the waveforms look like? What equipment was used?
Is this based on 1 cell or the results of many?
What What occurred with the samples at 1kHz... they jumped.

My honest feeling is that if this information was accurate you would see more papers and data about using lower freq. to determine battery health by now. Published in 2013 the book is 7yrs old and there have been advances. On the surface the book looks good, but it brushes over things and doesn't seem to provide proper reference to the backing data. It's a book to make $ lacking engineering support and focus.
I did find the BIT-BMS which uses low freq. but the low freq is only used for SOC% and 1kHz is still used to determine if cells are good or not.
 
The reason you cant determine soh of a battery via for instance IR is because it isnt accurate enough. If that would have been the case guess what :D

With that said you can get some kind of in indication of "Older" cells. This is what Wolf and co have shown. Same as can be seen in the whitepapers out htere if you read a coupld and add upp the information.

This also relates to that degradation beyond 80-60% SOH is also a bit vague. Not in terms of tests but in terms of how the cells behave. There are a couple of REALLY good articles out there showing it.

I have also done my fair share talking to some bigger manufactures about above topic and have gotten that confirmed. Its an very interesting topic. Especially if you like statistics and analysed data. Because you can with the numbers turn them in such a direction that they fit the goal of your report :D

bla bla blah.. Enough ramble from me :p
 
daromer said:
................... Especially if you like statistics and analysed data. Because you can with the numbers turn them in such a direction that they fit the goal of your report :D

bla bla blah.. Enough ramble from me :p

Exactly what I said.

We are mostly laymen here not college professors looking for a sponsorship from some agency on how to test LI-ion batteries with outcomes skewedto somespecial interest group or manufacturer.


Eh you can rabble its allowed :D

Wolf
 
Wolf said:
There are onlya few cells listed with SOH between these extremes - two about83% and one at 77% SOH. Butthey have thesame AC IR as other cells near100% SOH so AC IR can't detect these significant SOH differences.

You are talking about Cell # 1210,1220, and 1245
Actually if you took the time to dig through my excel sheet you would see that out of 171 tested CGR18650CGs 3 of them "failed" with a "normal AC IR" Oddly enough the Liitokala and Opus didn't think the DC IR was that bad. So what gives? [...]

Your prior post gave only (excerpted) images.I need the link to the spreadsheet with the DC IR values, and alsothe link to the postedgraph with IR vs remaining capacity.

I'll have to figure out how touse google sheets since I don't have excel here. It's difficult to make any conjectures until I can see more data points.

The DC IR should reveal more, but there could also be other factors that come intoplay. Are all the cells from the same source?Areall cells used or are some used and some new-old-stock?

Wolf said:
So that brings me to my next point.When are we going to see your testing procedures, results and numbers [...]

I don't build powerwalls so I have no further data on that. But I have extensive knowledge of Li-ion batteries from prior (professional) work, so I may be able to help in various ways.
 
This has been an quite interesting exchange, what may becoming clearer in some regards is that the Wolf tester will hopefully be able to return IR measurements form an arry of frequencies and it is the array of frequencies that will matter.

The testing so far has gravitated to a single IR measurement (or two if the DC value is counted) and Wolfs current process of an IR filter before actually performing a cycle test is the right path. The next tester might (hopefully) be able to fingerprint enough cells to actually derive a close proxy to the actual health of the cell in seconds !

I still wonder if it is possible that the fingerprint of a cell that has been held at high state of charge (medipacks) for the majority of it's life will show up a very distinct fingerprint compared to the same cell that has been cycled from a lower state of charge. Unique pattern of degredation, which shows up in the IR fingerprint.

gauss163, as you will notice there is a mix of reactions to your input and it is this type of input which derives changes and thought and progress (not necessarily always in the direction originally envisaged). For me very much welcome different perspective, however it may apply.

Wolf, the IR to Capacity correlation chart, change it to a scatter plot as it will make it a lot, lot more clearer in many ways. IR one axis, capacity other axis. The correlation will show along with outliers and rough variation pattern (part caused by different internal chemistries). If you have enough cells of the exact same make wihin the scatter plot if this one set was a different colour. What you are also starting to get an idea off is that the testing you are performing and carrying out is starting to get closer to the leading edge, hence the questions as to your "obvious" why has not somebody else done it already....

Complexity rises exponentially for additional gains in "simplicity" until you get E=MC2.
 
Bubba said:
I too found that most of the book is too vague https://www.scribd.com/document/36910556...le-devices
I don't think the author did their own tests. There is too much information missing to support the conclusions they arrive at. What did the waveforms look like? What equipment was used?
Is this based on 1 cell or the results of many?
What What occurred with the samples at 1kHz... they jumped.

My honest feeling is that if this information was accurate you would see more papers and data about using lower freq. to determine battery health by now. Published in 2013 the book is 7yrs old and there have been advances. On the surface the book looks good, but it brushes over things and doesn't seem to provide proper reference to the backing data. It's a book to make $ lacking engineering support and focus.
I did find the BIT-BMS which uses low freq. but the low freq is only used for SOC% and 1kHz is still used to determine if cells are good or not.

As the introduction hints, that book is targeted at "engineers and do-it-yourself enthusiasts". Yes, of course, it would be better if it included more literature links but, alas, this is the norm for such popularizations of science. It's rare that leading experts even have the time or motivation to compose popularizations. We should be grateful when they do so. If you know of better introductions then by all means post them. In my experience they are few and far between.

Anyone who is seriously interested in learning more will have a good enough foundation from the book that they should be able to search the web to delve further.
 
Found the sheet, starting to play....

IR vs Capacity scatter (only showing the bulk of points in the 80-100 range)

image_trwszn.jpg


CGR18650CG - interesting falling off the cliff


image_rhcfuy.jpg


This makes me wonder, the left axis should ideally be the "unknown" remaining cycle life (Wh throughput), because the capacity of the cell does not fail linearly and for some rather fast at the end of life. hmmmm.... The point here is even thought a pack may have high mAh cells (if IR is ignored) in some will fail far far quicker than others and the big question is can these cells be identified with the next gen Wolf tester ?
 
gauss163 said:
The DC IR should reveal more, but there could also be other factors that come intoplay. Are all the cells from the same source?Areall cells used or are some used and some new-old-stock?

All cells where recovered from various laptop, medical, tool and whatever had 18650 batteries in it. No NOS.
I tried to stick with brand name stuff as the "replacement" batteries generally had generic chinesium cells in them.
So I would say 95% of the batteries recorded had certainly seen a multitude of cycles.
The laptop packs that had the sweet smell of soda or the district aroma of coffee usually produced some good cells as the laptop died and the battery was discarded.
Bonus for me...... :D

[size=x-small]gauss163[/size]
I need the link to the spreadsheet with the DC IR values, and alsothe link to the postedgraph with IR vs remaining capacity.
Everything is here you should be able to download it and at least get open office or some other free office suite to visualize the data.
https://drive.google.com/file/d/1NujY1eO6MKwGrpyEm185m6vpkMdb_Gp9/view?usp=sharing
gauss163
I don't build powerwalls so I have no further data on that. But I have extensive knowledge of Li-ion batteries from prior (professional) work, so I may be able to helpin various ways.

OKthat makes sense and any guidance is appreciated.

You may be able to use the online Excel viewer, editor. might have to put up with some adds but may help you.
Wolf

image_cddqvy.jpg
 
completelycharged said:
.................. What you are also starting to get an idea off is that the testing you are performing and carrying out is starting to get closer to the leading edge, hence the questions as to your "obvious" why has not somebody else done it already....

Glad you found the sheet. Excellent!

Why Has nobody done this already?
Well for one thing it's time consuming. You are looking at data accumulated over a 10 month period. Almost every day entering data and testing.
Then another 3 month or so rechecking all the cells.

Maybe someone has done this beforewe just don't know it.
Although in this day and age of the internet and information sharing you would think we would know about it.

completelycharged
.............and the big question is can these cells be identified with the next gen Wolf tester ? ............

I may have to put that project up on github and maybe some skilled sketch writers can assist as my code writing skills are still in its infancy.Although quickly growing to adolescence. :)
Wolf
 
And so it begins.....................

What to do first?
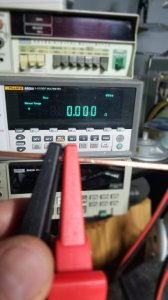
Yes find the 4 wire Probes for the fluke.
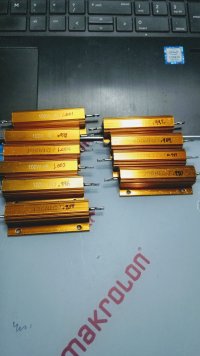
Find 1Ω 100W resistors.
Test Fluke 4 wire.

image_vahqaw.jpgimage_utuslz.jpg

Test 1Ω resistors for best and closest.

image_fnvlcp.jpg

Solder wires to Resistor and recheck.

image_dtvolc.jpg

Start the layout plan.

image_wxlhvs.jpg

Now waiting on the PCA9685 should be arriving today.

image_mqzvhx.jpg

Post to board.
Ordered 4Ω 100W resistors for a 1.05A draw.
Wolf
 
Last edited:
I see Spock giving the sign of approval to the project...

The PCA9685 is good for 24Hz - 1526Hz with 12 bit PWM accuracy so minimum pulse width of 160nS (1526Hz at 1bit PWM on state) so some interesting range, but nothing above 1.5kHz for now which may turn out to be ok as it avoids in the near term the wonders of harmonics and reactive power from places and wires you did not expect.

The ADC will ideally need to be syncronised to the pulse position to get a consistent reading if sampling at pulse resolution or with a longer sample window to average out the variations. I'm thinking here of say when a high load (say 4A from 4x4Ohm in parallel) at 1kHz is attached the voltage will drop from initial steady state quite quick and the shape of the drop as the charge state decreases will be interesting. 4 seconds (4000 samples ideally, 50+ ok) to get a pulse by pulse response, although this will need a different coding approach (buffer to memory then save to db). Will help out on the code..

I'm wondering if there is some additional good info a cell gives out relating to the energy out vs volt drop vs time in those initial seconds for high loading.

Maybe have the load arrangement software switchable ? approx 1A to approx 4A ? Arrange 4 and 1 Ohm resistors in parallel and switch in/out the 1 Ohm.
 
completelycharged said:
The PCA9685 is good for 24Hz - 1526Hz with 12 bit PWM accuracy so minimum pulse width of 160nS (1526Hz at 1bit PWM on state) so some interesting range, but nothing above 1.5kHz for now which may turn out to be ok as it avoids in the near term the wonders of harmonics and reactive power from places and wires you did not expect.
I know it has been a while since my electronics theory, can you get a PWM signal without harmonics. The sharper the on/off the higher the frequency the components to make it?

Too bad the PCA9685 doesn't allow each PWM to have it's own independent frequency. Does anyone know of one that does?
 
completelycharged said:
[...] I'm wondering if there is some additional good info a cell gives out relating to the energy out vs volt drop vs time in those initial seconds for high loading [...]

We obtainadditional info by correlating the DC voltage dropwith the (real part) of the impedance spectrum, which allows us toeffectively decomposetheDC resistanceintoits conceptualcomponents: ohmic, charger transfer, diffusion, etc. This is explained well in the Barsukov book I linked above - see esp. pp. 9-11 where you'll find a guided tour by an expert of the Nyquist-plotview of the impedance spectrum.

I will post some links and tips soon that will hopefully be useful to wolf or anyone else that has interest in these matters (alas, the last coupleof days wereunexpectedlyhectic somy spare time was limited).
 
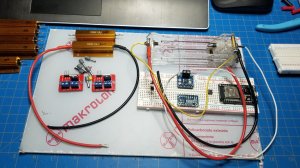
OK while you guys work out the theory here is the prototype for the hardware.
All attached devices are functional and recognized by the ESP32 love that i2c bus.
The only problem was the INA260 and the PCA9685board had an address conflict...... . well a little dab of solder took care of that. :D
Still got to hook up the V divider for the ADS1115 and get the DS18B20s online but that's easy.
Now to start combining the code for the hardware to make some magic happen...............

Wolf

image_ekvphp.jpg
 
Last edited:
Back
Top