1 Introduction
This is the documentation of some experiments I performed in order to ascertain whether it's possible to detect cells generating excessive heat (aka "heaters") in a diy 18650 battery pack built using the popular 5x4 20.2 mm pitch 18650 cell holders. All of the findings should be applicable to bigger cell arrays as well.2 tl;dr
By using an array of LM75 temperature sensors attached to one side of a 18650 cell pack abnormal heating of a single cell to a temperature of at least 50 deg Celcius results in a measureable (2 deg C) temperature anomaly which may allow for heater detection before a major pack failure has chance to occur.3 Experimental setup
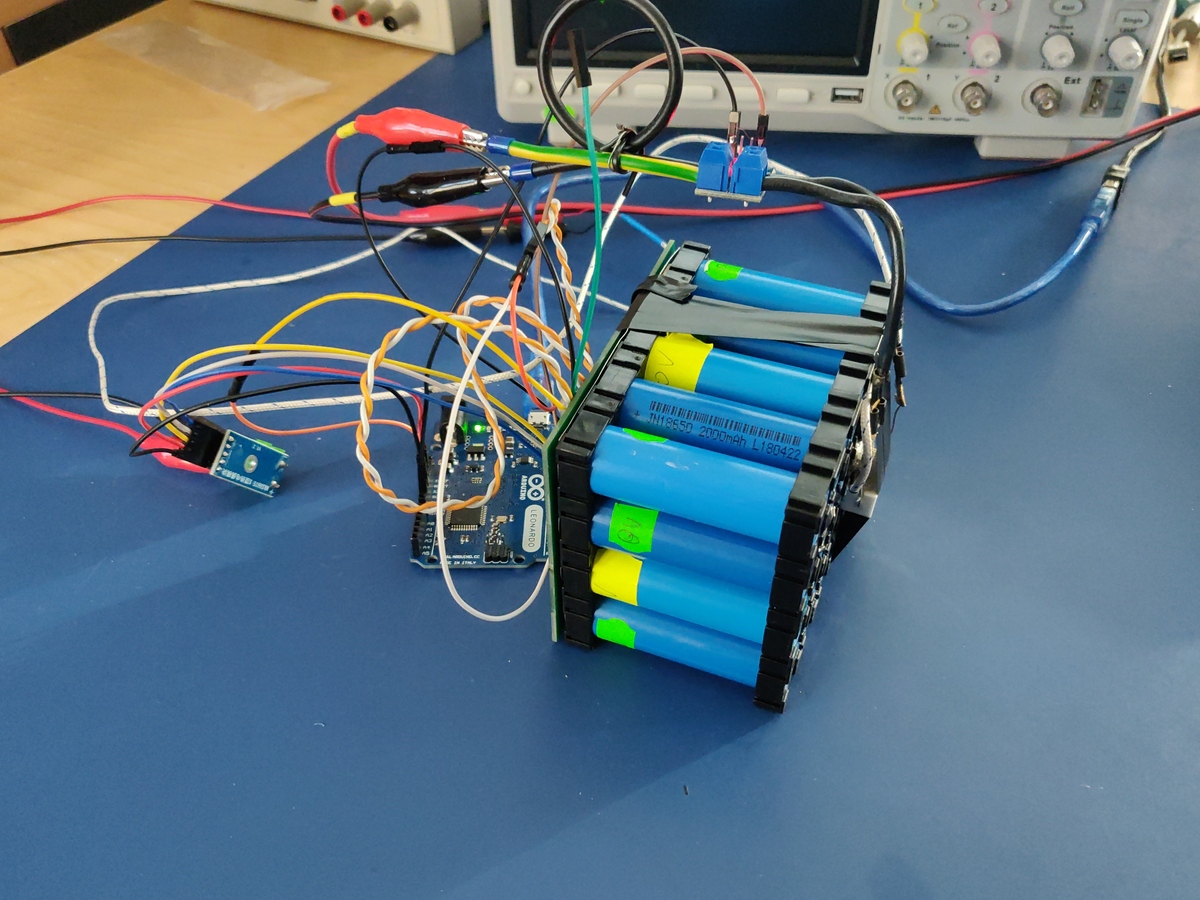
The experimental setup consists of a fake "pack" built out of 20 no-name 18650 cells connected (spot-welded) to a short strip of the 5P continuous nickel fuse roll from batteryhookup. The cells were welded only on the positive side with a small heater attached to the negative side of a single cell in order to simulate a "heater" cell. The cells used were junk cells having 0V and no charge in them for safety. The following image illustrates the experimental setup:
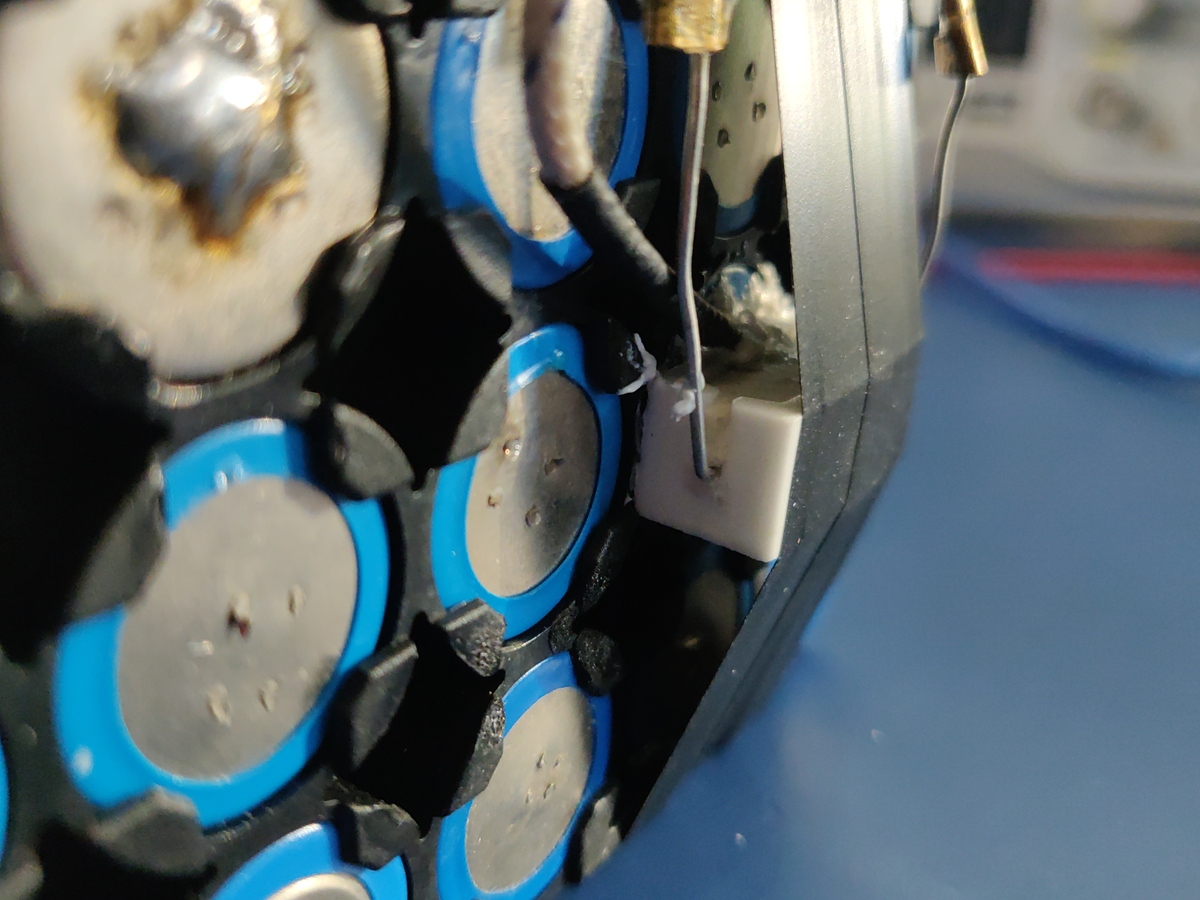
The heater assembly consists of a 10 Ohm / 5W resistor attached to the negative side of a single cell with thermally-conductive adhesive. A MOSFET is used to regulate the current flowing through the resistor with PWM. An K-type thermocouple is attached to the cell next to the heater resistor in order to for a closed feedback loop to stabilise the heater temperature. The temperature from the thermocouple is being read using a MAX6675 breakout board. The top PCB contains five LM75 I2C temperature sensors soldered in a very simple chain:

The temperature sensors are labeled U1-U5 and their relative locations can be seen on the PCB silkscreen. The location of the fake heater cell is indicated with the "HEATER LOC 1" text. During the experimental runs the temperatures read from U1-U5 sensors are logged into a CSV file for analysis. The assembled experimental setup can be seen below:


4 Software
The experiment is being controlled by an Arduino sketch which performs the following functions:- regulates the heater temperature using a very primitive PID regulator driving a PWM output regulating current flow through the heater resistor
- periodically reads out all temperature readings and prints them on the serial port
void loop() {
float temp = thermocouple.readCelsius();
float deltaT = target_temp - temp;
float pwm_drive = min( max(deltaT * P, 0), 1023);
// read temperatures for the ZIF-20C-TEMP board
float temp_U1 = U1.readTemperatureC();
float temp_U2 = U2.readTemperatureC();
float temp_U3 = U3.readTemperatureC();
float temp_U4 = U4.readTemperatureC();
float temp_U5 = U5.readTemperatureC();
Serial.print("target_temp[degC] = ");
Serial.print(target_temp);
Serial.print("\ttemp[degC] = ");
Serial.print(temp);
Serial.print("\tpwm[%] = ");
Serial.print(map(pwm_drive, 0, 1023, 0, 100));
Serial.print("\tU1[degC] = ");
Serial.print(temp_U1);
Serial.print("\tU2[degC] = ");
Serial.print(temp_U2);
Serial.print("\tU3[degC] = ");
Serial.print(temp_U3);
Serial.print("\tU4[degC] = ");
Serial.print(temp_U4);
Serial.print("\tU5[degC] = ");
Serial.print(temp_U5);
Serial.println();
analogWrite(heaterON, pwm_drive);
// For the MAX6675 to update, you must delay AT LEAST 250ms between reads!
delay(300);
}
The data printed by the Arduino code was monitored, plotted and logged using QtSerialMonitor which I unfortunately had to build from source code myself. An example data point gathered in the CSV file is presented below:
"time","target_temp[degC]","temp[degC]","pwm[%]","U1[degC]","U2[degC]","U3[degC]","U4[degC]","U5[degC]",
2022-01-09T15:01:18.890Z,70.000000,24.750000,100.000000,22.500000,23.000000,23.000000,23.000000,22.500000,
The columns convey the following information:
| Column name | Value description | Unit | Notes |
|---|---|---|---|
| time | timestamp | ISO-8601 UTC | |
| targettemp[degC] | the heater setpoint | Celcius | |
| temp[degC] | the heater thermocouple temperature | Celcius | |
| pwm[%] | current PWM output | % | Rescaled from 0-1023 to 0-100% |
| U1[degC] | current temperature for the U1 sensor | Celcius | |
| U2[degC] | current temperature for the U2 sensor | ||
| U3[degC] | current temperature for the U3 sensor | ||
| U4[degC] | current temperature for the U4 sensor | ||
| U5[degC] | current temperature for the U5 sensor |
5 Experimental runs
There were 3 experimental runs performed with different temperature setpoints for the heater but otherwise identical circumstances. Ambient temperature was not controlled but can be seen in the initial readouts from U1-U5 before the heater power supply was switched on. Each experimental run consists of four phases:- baselining - the temperatures are logged but the heater power supply is not yet switched on, used for logging baseline information from sensors
- warmup - the heater power supply is switched on and the heater temperature starts to rise and stabilises around the target setpoint
- observation - the data from the temperature sensors is logged for a few hours
- cooldown - the heater power supply is switched off and the cell begins to cool down, experiment is again left for a couple of hours for the temperatures to again stabilise
| Experimental run | Heater setpoint | Raw data | Notes |
|---|---|---|---|
| Run 1 | 70 | 09.01.2022_15.47.18.318Z_Log.csv | |
| Run 2 | 60 | 10.01.2022_14.57.09.844Z_Log.csv | |
| Run 3 | 50 | 11.01.2022_10.23.06.399Z_Log.csv |
6 Data analysis
The goal of the experiment is to ascertain whether an array of simple temperature sensors attached to a 18650 cell pack can successfully detect and/or locate a cell experiencing abnormal heat generation during charging or discharging.6.1 Detecting a heater cell
In order to move towards this goal first some analysis was done on the raw data to check if there is any difference between the temperatures detected by particular sensors in order to detect an anomaly. A Python script was developed for this purpose and ran against the gathered CSV data dumps:import pandas as pd
import numpy as np
columns = [ "time","target_temp[degC]","temp[degC]","pwm[%]","U1[degC]","U2[degC]","U3[degC]","U4[degC]","U5[degC]" ]
data = pd.read_csv(csv_filename, usecols=columns)
data['min_temp'] = data[['U1[degC]', 'U2[degC]', 'U3[degC]', 'U4[degC]', 'U5[degC]']].min(axis=1)
data['max_temp'] = data[['U1[degC]', 'U2[degC]', 'U3[degC]', 'U4[degC]', 'U5[degC]']].max(axis=1)
data['temp_anomaly'] = abs(data['max_temp'] - data['min_temp'])
print(f'Data from {csv_filename}:')
print(data)
print('Temperature anomaly:')
print(data['temp_anomaly'].describe())
6.1.1 Experimental run 1
Data from in-situ-18650-heater-detection/09.01.2022_15.47.18.318Z_Log.csv:time target_temp[degC] ... max_temp temp_anomaly
0 2022-01-09T15:01:18.890Z 70.0 ... 23.0 0.5
1 2022-01-09T15:01:19.198Z 70.0 ... 23.0 0.5
2 2022-01-09T15:01:19.507Z 70.0 ... 23.0 0.5
3 2022-01-09T15:01:19.815Z 70.0 ... 23.0 0.5
4 2022-01-09T15:01:20.123Z 70.0 ... 23.0 0.5
... ... ... ... ... ...
69266 2022-01-09T21:01:52.570Z 70.0 ... 25.5 1.0
69267 2022-01-09T21:01:52.875Z 70.0 ... 25.5 1.0
69268 2022-01-09T21:01:53.193Z 70.0 ... 25.5 1.0
69269 2022-01-09T21:01:53.491Z 70.0 ... 25.5 1.0
69270 2022-01-09T21:01:53.797Z 70.0 ... 25.5 1.0
[69271 rows x 12 columns]
Temperature anomaly:
count 69271.000000
mean 2.648713
std 0.707099
min 0.000000
25% 2.500000
50% 3.000000
75% 3.000000
max 3.500000
Name: temp_anomaly, dtype: float64
6.1.2 Experimental run 2
Data from in-situ-18650-heater-detection/10.01.2022_14.57.09.844Z_Log.csv:time target_temp[degC] ... max_temp temp_anomaly
0 2022-01-10T14:01:10.676Z 60.0 ... 23.5 0.0
1 2022-01-10T14:01:10.982Z 60.0 ... 23.5 0.0
2 2022-01-10T14:01:11.289Z 60.0 ... 23.5 0.0
3 2022-01-10T14:01:11.595Z 60.0 ... 23.5 0.0
4 2022-01-10T14:01:11.903Z 60.0 ... 23.5 0.0
... ... ... ... ... ...
42364 2022-01-10T18:01:02.073Z 60.0 ... 26.5 0.5
42365 2022-01-10T18:01:02.379Z 60.0 ... 26.5 0.5
42366 2022-01-10T18:01:02.691Z 60.0 ... 26.5 0.5
42367 2022-01-10T18:01:02.996Z 60.0 ... 26.5 0.5
42368 2022-01-10T18:01:03.301Z 60.0 ... 26.5 0.5
[42369 rows x 12 columns]
Temperature anomaly:
count 42369.000000
mean 1.864240
std 0.648193
min 0.000000
25% 1.500000
50% 2.000000
75% 2.500000
max 2.500000
Name: temp_anomaly, dtype: float64
6.1.3 Experimental run 3
Data from in-situ-18650-heater-detection/11.01.2022_10.23.06.399Z_Log.csv:time target_temp[degC] ... max_temp temp_anomaly
0 2022-01-11T10:01:06.960Z 50.0 ... 25.0 0.0
1 2022-01-11T10:01:07.269Z 50.0 ... 25.0 0.0
2 2022-01-11T10:01:07.586Z 50.0 ... 25.5 0.5
3 2022-01-11T10:01:07.883Z 50.0 ... 25.0 0.0
4 2022-01-11T10:01:08.188Z 50.0 ... 25.0 0.0
... ... ... ... ... ...
58714 2022-01-11T15:01:39.845Z 50.0 ... 26.0 0.5
58715 2022-01-11T15:01:40.154Z 50.0 ... 26.0 0.5
58716 2022-01-11T15:01:40.462Z 50.0 ... 26.0 0.5
58717 2022-01-11T15:01:40.767Z 50.0 ... 26.0 0.5
58718 2022-01-11T15:01:41.075Z 50.0 ... 26.0 0.5
[58719 rows x 12 columns]
Temperature anomaly:
count 58719.000000
mean 1.545079
std 0.538658
min 0.000000
25% 1.500000
50% 1.500000
75% 2.000000
max 2.000000
Name: temp_anomaly, dtype: float64
As expected the observed maximum anomaly is larger when the heater setpoint is hotter:
| Run | Heater setpoint [degC] | Maximum temperature anomaly | Notes |
|---|---|---|---|
| Run 1 | 70 | 3.5 | |
| Run 2 | 60 | 2.5 | |
| Run 3 | 50 | 2 |


