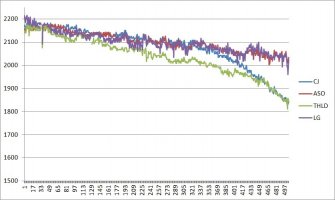
Results of Capacity Testing 18650s for 1,600+ Cycles

ozz93666 said:
I tend to agree , but this is a comparative test .. As long as same procedure was used throughout these are accurate results ...

As far as Cell A is compared to Cell B and C - yes, it's comparative and it's OK, but for checking datasheet's numbers you need absolute results. If the datasheet tells 2.5V cut-off, then you must discharge down to 2.5V. If it tells "10min pause after charge and 30min pause after discharge" - you must follow the instructions to compare your results with manufacturer's ones.

ozz93666 said:
Contact resistance due to cell not being held firmly won't effect capacity readings significantly

I'm talking about the material the contacts are made from, not the power of holding the cell. Compare the voltage drop from the cell to Opus' PCB with the same if the contacts were replaced with pure copper ones.
 
Thunderheart, you are correct about the Opus, and we have gone over its shortcomings on the first page of this thread.

We respect your testing as reliable on this board - enough to give you a sticky for your testing thread. You have gone through great pains to make sure that you are testing cells most accurately to their data sheet.

This test, however, is a bit different. Its sole purpose is to track the degradation of 4 cells over a number of cycles. And 3 out of 4 of the cells in this test have no data sheet, and that was part of the inspiration for this test. The full testing method has been described in the Original Post of this thread. I've taken care to eliminate any sort of inaccuracies of the tester, even alternating the slots every 25 cycles.

So, for this test, consistency is more important than absolute capacity numbers.

With regard to the smooth versus jagged line, I believe manufacturers use some smoothing on their degradation curves, as well as testing multiple cells and averaging their plots. If I plotted the average of every 5 cycles (81 data points) instead of the results of 405 cycles (405 data points), it would be a lot smoother. Most of the variances come from the cell resting overnight, or possibly the IR of the cell, but it's never that extreme (besides Cycle 35 where I used an external fan to cool the cells and had like a 3% variance).

ozz93666, I've been testing these cells almost 5 months straight, and I'm only at 405 cycles. If I were to test these cells only 50 times a year, It would take me over 8 years to get to this point. I do think time does play some role, but mostly it's the time cells sit at full charge that makes the most difference. All of the cells in this test are about 8 years old, and I do have some 20 year old Sony's that I've tested that still hold 90%+ of their capacity with an unknown history. Since the cells internals are sealed, I can't see why the electrolyte would break down over time, but everything does have a shelf life.
 
Generic said:
This test, however, is a bit different. Its sole purpose is to track the degradation of 4 cells over a number of cycles

In that case everything is OK as all 4 cells are in equal conditions.

Once again, you've done a GREAT job and i can just imagine the time and other resources spent on it!
 
thunderheart said:
ozz93666 said:
I tend to agree , but this is a comparative test .. As long as same procedure was used throughout these are accurate results ...

As far as Cell A is compared to Cell B and C - yes, it's comparative and it's OK, but for checking datasheet's numbers you need absolute results. If the datasheet tells 2.5V cut-off, then you must discharge down to 2.5V. If it tells "10min pause after charge and 30min pause after discharge" - you must follow the instructions to compare your results with manufacturer's ones.

ozz93666 said:
Contact resistance due to cell not being held firmly won't effect capacity readings significantly

I'm talking about the material the contacts are made from, not the power of holding the cell. Compare the voltage drop from the cell to Opus' PCB with the same if the contacts were replaced with pure copper ones.
This test is all about measuring reduction in capacity over cell life , measuring the % drop , so using opuswill not effect things too much , particularly at low discharge currents....

My instinct tells me the material the contacts are made from will not have a significant effect ...
Lets do the calculation just to check .... your terminals are 10mm x 0.5mm thick so that's5mm2 of copper

Each 1 cm has a resistance of 0.134 mOhm ...

but that is not where the resistance is , you connect onto these buss bars with crocodile clips ... Danger High resistance (a few mOhm ) ... much better to solder (Zero mOhm ) , and then thickwires connecting to your apparatus, probably around 5mm2 ,same as bus bar but total length looks about 60cm so resistance of wire is 8m Ohm ...

You have about 10mOhm between battery and measuring device ... How will this effect readings ... it will effect high current discharge much more ...@ 5 A ... I x I x r = 0.25W So @ 5A the connectors are disappearing0.25W over a 1/2 Hr discharge resulting in a 0.125WHr error in capacity measurement ...... at 1A discharge the error will be 5 times lower 0.025WHrs. these losses are totally predictable , perhaps the measuring device has already adjusted readings??

Compared to opus , lets suppose their contact terminals are 10 time more resistive than yours , still that willnot have much effect on things because they are very short , connecting wires will be much thinner , but also much shorter ... the killer lies in the weak springs and type of contacts used to force connection onto the cell this can cause many 10'smOhm resistance.
 
Thanks for your input Thunderheart! Honestly, if I added up all the actual time I spent on this, it wouldn't be more than a few hours. It's just writing down the results every cycle, taking a picture of those results, and resetting the Opus. If all that took a minute, that's 6.75 hours for 405 cycles. Not bad. And its just 1 Opus, so not much material cost either.

oz93666, I know that the Opus overstates the results. The three generic cells are all 2000mAh cells and the Opus was showing almost 2200mAh when the test started. The point is, like you mentioned, that the contact resistance in the cell holders does not change. Whatever that resistance is, does not matter as long as it stays the same throughout the whole test. The only variable I'm testing for here is degradation.
 
2.5V cut-off does not mean you should normally discharge the cell down to that value. That's the red-alert-emergency-shutdown value. I would never recommend discharging any cell under 3V if you want some life out of them. I always try to keep them above 3.3V as per the original Li-Ion specs.

Yes, some manufactures consider that discharge value when stating capacity, which is not really fair, but this forces you to indeed consider it when testing.
 
I did my own amateur comparative testing with my Opus BT-C3100 v2.2 on my haul of dead laptop batteries. Of the 150 cells I pre-tested so far, the LG batteries are consistently worse than others in terms of internal resistance at max charge. (To me it's a quick rough indication of capacity because it's inversely correlated to IR)

Therefore, I'd be much interested if your control test used a Panasonic or Samsung instead :D. Either way, thank you for the rigorous tests! I also get some ASOs in my haul and those are also quite promising in my prelim max-charge IR tests.
 
Awesome test Generic! I'm happy to see cells degrade indeed a bit slower then I thought they would.

Do we have some idea as to how much not fully charging/discharging is prolonging there live? And what limits do most people use?
 
Thanks for doing these tests and sharing your results.

Back in 2014 I started an individual effort to improve characterization of scavenged cells. I think I was the first english speaker to get a ZKE tester and share info about it, I wrote and shared some code to extract BMS data from laptop packs, and had preliminary results showing that self-discharge rate wasn't a very useful proxy for the cycle-age of cells. I'd hoped to grow a community around it, but I ran out of steam and other priorities took over. I didn't have the impact I'd hoped, but it's great to see that that so many people have taken up the charge on their own.

I hadn't given much attention to "generic" cells, but I suspected that the conventional wisdom that they were junk was probably obsolete even then, and if it wasn't, it soon would be due to ongoing improvements in Chinese manufacturing. You've certainly shown that they should be taken more seriously.

You'd done a good job of refuting those who suggest these tests aren't valid or useful because you are using an Opus, but I'm going to add my two cents, anyway. A "professional" knows that there are multiple dimensions to the utility of any measurement instrument. Off the top of my head, the key considerations are cost, accuracy, precision, and repeatability/consistency. If the cost of an instrument is low enough, two or more can be used. Accuracy can be corrected with a few measurements and simple math, or simply factored out by using relative measurements. Precision can be addressed with larger sample sizes, or, for many purposes, by accounting for uncertainty, and not drawing conclusions unsupported by the precision of the data. Consistency can also be addressed with samples size and uncertainty propagation.

The one problem I see with using the Opus in a test like this is that the effects of systemic sources of error can accumulate over each cycle. For example, the temperature difference between slots means that each cell has different thermal conditions, which is known to impact cell aging.

Also that small differences in the measurement of voltage between channels can impact charge/discharge termination points, and charge/discharge current. This has some impact on capacity measurements, but that is relative. The real issue is that the cell in one slot may be pushed a little further than the other. The difference may only be 0.1% per cycle, but that increases exponentially, so after 50 cycles it grows to 5% (1.001^50-1.0^50).

You've addressed these by switching slots, but doing it more often might be a good idea. I also think that spinning the cell in the slot slightly between cycles could even out the impact of small variations in contact surface/resistance.

The "jaggedness" on the measurement curve are probably influenced at least in part by differences in ambient temperature between measurements. Temperature differences impact both the cell performance, and also the measurements of voltage, current and charge.

As for why these cells are holding up better than expected, one reason is probably just the nominal values from datasheets are close to worst case. They give their industrial customers the information they need to hit the performance and reliability specs demanded for their application. It's bad for profit margins to give away too much, but they can be improved in the future. On the other hand, fail to deliver on specs will kill the business. So, the datasheet values are surely conservative. Over time, though, as the manufacturers get better better at consistency, they'll be able to narrow the gap between the specification and the actual performance of a typical cell.

It's good to have a sense of both the testing system, and the application of its results, because it helps keep perspective about what's good enough (for now, at least).
 
Generic said:
The only variable I'm testing for here is degradation.

I was just wondering how stable temperature has been during your testing?
I am doing some degradation testing on a couple of cells too, and I have noticed that temperature seems to make a noticeable difference to the capacity results.
Just from observation, tests overnight (approx 5-10 degrees C) were lower than tests during the day (approx 20-25 degrees C)
An overnight test might show 1950mah while a daytime test might show 2050mah.
I have started recording time and test start temperature along with my tests.
What are temperatures where you are doing your testing? How stable is the temperature? And have temperature ranges changed over the period you have been testing (eg seasons)?
 
505 Cycles!!!! (Actually, I just finished Cycle 535, but I just got the time to post this now).

Here are the results:

image_emogsj.jpg


image_mctmwd.jpg


And the degradation:

image_jjzdmj.jpg


One thing that these capacity tests do not show is IR. Even though the LG cell is doing pretty well, it definitely has the highest IR. It takes the longest to charge, and it has the highest "bounce" voltage on the first test in the morning. The THLD cell, though it lost a lot of capacity, still has the tightest voltage and is the fastest to charge. I could literally do 4 tests a day if it was only the THLD cell, but the LG cell is slowing me down. It's getting to the point that I have like a half-hour window to take a picture of the third result of the day between when the THLD cell is fully charged after its third cycle and the LG cell finishes discharging its third cycle.


Androfire - I was hoping to use a Samsung, since they seem to have the highest respect, but the ones I had were too low in capacity and I didn't want it to look like I used a bad Genuine cell to inflate the performance of the Generics. So I had to use the LG - it was the best capacity 2200mAh genuine cell that I have. Ideally, I would have started with a brand new cell, but I never thought I would get to 500+ cycles, so here I am.

AcE Krystal - Well, I am fully charging and discharging these cells, so I don't have any hard data on limiting voltage ranges to prolong life. That kind of test takes a lot of time and sensitive equipment, neither of which I have.

eas - Actually, I do believe self-discharge rate and cycle-age are correlated. When I look at my genuine cells, the cells that self discharge more usually have less capacity. There are of course damaged cells that have great capacity and self-discharge a lot, but in general, cells that are near full capacity will still be at 4.18V after 6 months, while the ones that only have 70% will be around 4.12V after 6 months. Also, don't get me wrong, there is still a lot of Chinese junk out there. But it seems that even in 2011 when these cells were produced, some Chinese manufacturers were already producing decent quality cells. I guess it's like Honda/Toyota in the 80s or Hyundai in the 2000s got a bad wrap for producing junk, and it took some time until those cars became mainstream. I was also considering switching slots every cycle and rotating the cells randomly, but didn't for 2 reasons - (1) I hand wrote capacities and later transferred to a computer; it was easier to keep track of the cells and their capacities every 25 cycles than every cycle; and (2) I didn't rotate the cells in order to keep the cell's label on every picture I took. With the personality I have, I don't really trust anyone I don't know, and I always am second guessing their motivation for giving me information. Usually if someone is trying tosell me something, I assume the opposite of what they say must be true. Anyway, by keeping the cells label-up for the pictures I took of every cycle, I wouldn't have someone telling me the test is fake because I was switching out cells for new ones all the time to inflate the generic cell's results. Paranoid? Maybe. I guess you could photoshop results, too. Anything can be photoshopped, but now that would be paranoid. Yes, part of the jaggedness would be temperature variations. But also, internal resistance, the Opus' margin of error, and how long the cell was charged from the previous cycle all play a part. Again, if I were publishing a scientific paper on this, or selling these cells to a large buyer, you bet I would be doing all you mentioned, as well as Thunderheart, Oz18650, and the rest. All very good suggestions on making this test 100% accurate and reliable. I was just going for good enough for our community while minimizing the shortcomings. People are free to treat my test as inaccurate, and I welcome literally anyone else to do this test over with better equipment and publish the results for everyone free of charge.

Oz18650 - This test was performed by me in my home. The coldest it would get in my home would be 70*F in winter and in the summer maybe 82*F in the afternoon. But that would be minimum and maximum. Most of the time my home is between 74*F and 76*F. I also never test overnight for obvious reasons, not that it would matter much indoors. I agree that temperature matters a lot - look at my post about Cycle 35 where I just ran a 120mm computer fan over the cells. There was a 3-4% decrease in capacities for that cycle.
 
605 cycle update: Degradation on the CJ and THLD cells looks like it is accelerating. The LG and ASO cells are still degrading fairly linearly. The test is getting a bit slower, I'm doing about 2 cycles a day instead of the usual 3 cycles. I'm going to continue this test, but I'm starting to get a bit fatigued by it. I have been doing this since January!


image_verhhv.jpg


image_mrdmoh.jpg


image_cixcuf.jpg
 
Generic said:
605 cycle update: Degradation on the CJ and THLD cells looks like it is accelerating. The LG and ASO cells are still degrading fairly linearly. The test is getting a bit slower, I'm doing about 2 cycles a day instead of the usual 3 cycles. I'm going to continue this test, but I'm starting to get a bit fatigued by it. I have been doing this since January!

...

Fascinating information. I imagine if you are going to test a cell to its final end, it's going to take way too long.

It would be interesting to know if these cells have begun to self discharge yet.
 
Based on the curves in the chart, I'm expecting the CJ and THLD to get to 0 capacity around 800 cycles, maybe? Self-discharge would mean I would have to stop testing for a week or so, and I can guarantee you that I won't continue the test if I do that, so I'll hold off for now.

That being said, I have noticed that the initial voltage drop on the LG and ASO cells has been rather high, like the cell dropping to 4.00V after just a minute of discharge from 4.2V. The CJ and THLD, despite their capacity loss, only drop to around 4.12V in the same time.
 
Generic said:
Based on the curves in the chart, I'm expecting the CJ and THLD to get to 0 capacity around 800 cycles, maybe? Self-discharge would mean I would have to stop testing for a week or so, and I can guarantee you that I won't continue the test if I do that, so I'll hold off for now.

That being said, I have noticed that the initial voltage drop on the LG and ASO cells has been rather high, like the cell dropping to 4.00V after just a minute of discharge from 4.2V. The CJ and THLD, despite their capacity loss, only drop to around 4.12V in the same time.

That is really quite intriguing. It would be great if you had an iCharger or similar, to get a graph of the discharge voltage. Perhaps even set up a camera, to take photos every 5 minutes. If you uploaded a zip of the images, I would type them out so you could graph them. Shouldn't take me too long.
 
It is interesting to me that of the four cells 2 are behaving similarly to each other while the other 2 are similar to each other.
 
I'm intrigued about the performance above 80% (1760 mAh). Most of us out there are using some kind of combination of capacity, % capacity, resting voltage, and IR to determine that a cell will continue to perform as tested for an acceptably long amount of time after harvesting. In the case of the two cells that are rapidly dropping off, if I were to harvest them when they were testing at 2000mAh they would look okay in terms of capacity and % capacity, do you think they would pass resting voltage and IR checks too?

Are the standard tests enough to catch cells that are about to nosedive?
 
Oz - I am starting to think that the CJ and THLD are both made by the same manufacturer, just different labels. It's rumored on this forum and on other forums that ASO are rewrapped rejected Samsungs, which could explain why it is closely tracking the LG cell.

Nemo - The standard tests are standard because they are fairly quick and reasonably accurate. But they won't catch everything. Even though I rebranded myself "Generic," I did harvest about 1,300 genuine cells before I had the opportunity to get around 10,000 new-old-stock generic cells for pretty cheap. I just went through a 5 month process of retesting my 1300 genuine cells (and putting them into storage voltage), and there were 42 cells that tested well initially (between 80 and 95% of original capacity), did not self discharge, but retested at 30-40% capacity after sitting at full charge for anywhere between 8 months and 1 year. And these were not cells that were recovered from 0V or anything, just very normal cells. Apparently, this is not new, I read about this phenomenon in a Battery University article, but it is a risk that you take. I wish I had taken IR measurements along the way, but I never invested in an IR tester, so we will never know. All I know is that manufactures usually quote how many cycles you get above 80%, so I'm guessing most cells will nosedive some short time after 80%.
 
I do not know, but it may be that quoting 80% is a business decision, rather than for technical reasons.
Once something battery powered losses more than 20% of its runtime, it is definitely not running "like new".
The next number down (75%) might be too low for cell buyers and the next number up (85%) might be too high for the cell makers, so they settled on 80%?
 
Wow, you did all these cycles manually? If you're interested in continuing this sort of testing I could send you an 18650 cycle tester I've been working on (would be an older version of which I have several), details are here: http://rev0.net/index.php?title=CCR It sure seems easier than manually restarting a cycle on these cells and taking down the data.
 
Back
Top